Water Supply Outlook April 2017
Updated: April 7, 2017
Mountain runoff forecasts (natural volumes for March to September 2017)
Milk River basin- Much above average for Milk River at Western Crossing and at Milk River for the March to September period, except for Milk River at Eastern Crossing which is above average
- Above average for April to September
- March recorded volumes are much above average
- Above average for the March to September period, except for Belly River which is much above average
- Above average for April to September, except for the Belly River and Waterton River which is much above average
- March recorded volumes are much above average
- Average to much above average for the March to September period.
- Average to much above average for April to September
- March recorded volumes are average to much above average
- Above average for Red Deer River at Dickson Dam for the March to September period, except for Red Deer River at Red Deer which is average
- Above average for Red Deer River at Dickson Dam for April to September, except for Red Deer River at Red Deer which is average
- March recorded volumes are much above average
- Much above average for Lake Abraham for the March to September period, except for Brazeau Reservoir and North Saskatchewan River at Edmonton which is below average
- Much above average for Lake Abraham for April to September, except for Brazeau Reservoir and North Saskatchewan River at Edmonton which is below average
- March recorded volumes are average to much above average
Precipitation can have a major impact on water supply between now and the end of September. The forecasts above assume that precipitation over the remainder of the winter period and through the summer will be normal. The range of possible precipitation scenarios is large however, and as a result, probable range forecasts and a minimal precipitation forecast of natural runoff volume are also provided for each individual basin. Since more information becomes known over time, forecast ranges will narrow. Streamflow volume forecasts are updated monthly from February to May, and again in July.
Check our Forecaster's Comments throughout the month for updated information regarding runoff conditions.
Mountain snowpack
Snow accumulations measured in the mountains as of April 1, 2017:
- Oldman River basin: Generally above average, ranging from 108% at Allison Pass to 133% at Many Glacier (7 sites surveyed).
- Bow River basin: Generally above average to much above average, ranging from 99% at Highwood Summit Bush to 139% at Chateau Lawn (21 sites surveyed). Low variability the average and median of the 21 sites is 116%.
- Red Deer, North Saskatchewan, Athabasca River basins:
Red Deer River basin: (2 sites surveyed) Gable Mountain at 114% and McConnell Creek at 134%.
North Saskatchewan River basin: High variability ranging from much below average at Southesk (90%) to much above average at Brown Creek (172%) (5 sites surveyed).
Athabasca River basin: (3 sites surveyed) 131% at Hinton, 81% at Sunwapta and 105% at Marmot-Jasper.
- Upper Peace River basin in British Columbia: as indicated in British Columbia's Snow Survey and Water Supply Bulletin
Mountain snowpack is an important source of water supply to reservoirs in the spring. Accumulation at this time of year typically accounts for nearly three-quarters of the seasonal total.
Plains Spring Snowmelt Runoff Forecasts
Runoff is either complete or is expected to be average to much below average, please refer to the map in the Plains Runoff Forecast section of our Maps and Data Summaries webpage.
Plains snowpack
- Map of Snow course measurements taken at the end of March and the beginning of April in many areas of central and northern Alberta.
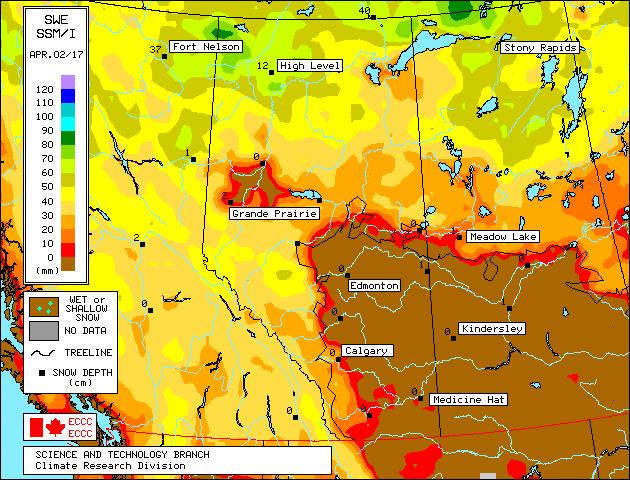
- Environment Canada map of satellite estimation of plains snow water equivalent (SWE) as of April 2, 2017 is shown here.
- Alberta Agriculture publishes maps of modelled plains snow accumulations and accumulations as compared to normal.
Precipitation
Contoured maps of precipitation amounts and as a percent of normal for the past month and for current and recent seasons are available here. Maps of precipitation amounts for the most recent day, week and month to date are available here.
Soil Moisture
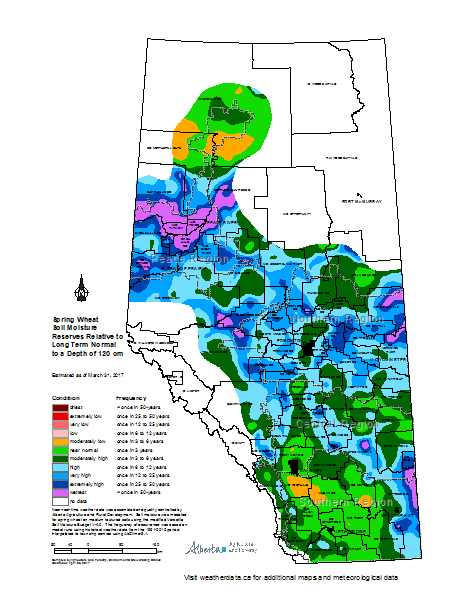
Alberta Agriculture models soil moisture for non-mountainous, agricultural areas of Alberta. Modelled soil moisture compared to average as of March 31, 2017 is available here.
Long Lead Precipitation Outlooks
Environment Canada (issued on March 31, 2017): Temperatures is forecast to be above normal for the April through June 2017 period, except for Cypress Hills area, which is forecast to be average. Precipitation is forecast to be normal for the April through June 2017 period, except for the northeastern corner of the province, which is forecast to be above normal.
National Oceanic and Atmospheric Administration (NOAA) (issued on March 16, 2017): An equal chance of below normal, normal or above normal temperature in southern Alberta for April to June 2017. Above normal precipitation in southern Alberta for April to June 2017.
Climate indicators: The NOAA reported on March 9, 2017 that ENSO-neutral conditions are favored to continue through at least the Northern Hemisphere spring 2017, with increasing chances for El Niño development into the fall.
Note that forecasting weather for such a long time period into the future is very difficult, and so the historical accuracy has been variable, dependent on location and time period, and is often low, more so for precipitation than temperature. Environment Canada provides an assessment of their forecast method's historical accuracy on their website.
Reservoir storage
Water storage volumes in the major irrigation and hydroelectric reservoirs of the Milk, Oldman, Bow, Red Deer North Saskatchewan, and Athabasca River basins is updated each weekday and is available in the Provincial Reservoir Storage Summary.
Questions
Background information on the Water Supply Outlook is available in Frequently Asked Questions
Media Contact:
Communications Division, Alberta Environment and Parks
Phone: (780) 427-8636