Water Supply Outlook January 2014
Updated: January 13, 2014
Mountain runoff forecasted natural volumes for March through September 2014
- Below average
Precipitation can have a major impact on water supply between now and the end of September. The forecasts above assume that precipitation over the remainder of the winter period and through the summer will be normal. However, the range of possible precipitation scenarios is large, therefore probable range forecasts and potential minimum forecasts of natural runoff volumes are also provided. As more information becomes known over time, forecast ranges will narrow. Streamflow volume forecasts are updated monthly from February to May, and again in July.
Check our Forecaster's Comments for updated information regarding runoff conditions.
Mountain snowpack
Snow accumulations measured in the mountains as of January 1, 2014
- Oldman River basin: Highly variable, but generally below average to average.
- Bow River basin: Moderately variable, but generally average to slightly above average.
- Red Deer: Below average to above average, based on 2 locatations (Limestone Ridge and Skoki Lodge pillow stations).
- Upper Peace River basin in British Columbia: Locations near the upper Smoky River basin range from 126 to 155% of normal
It is early in the winter, and snow measurements are only conducted at about half the locations. A full data set will be available in February. Mountain snowpack is an important source of water supply to reservoirs in the spring. Accumulation at this time of year typically accounts for nearly two-fifths of the seasonal total.
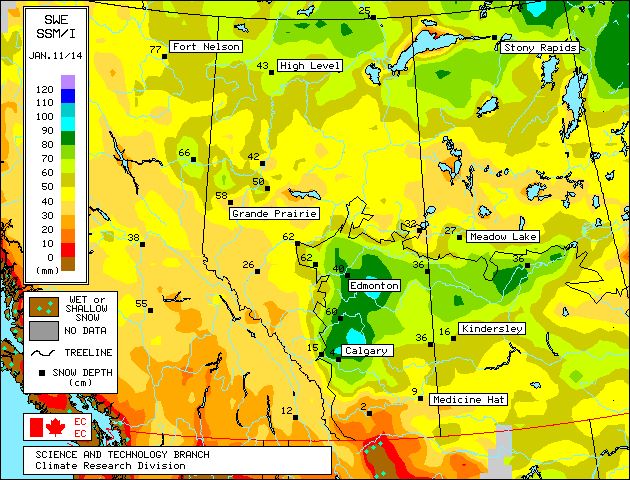
Plains snowpack
- Information on plains area snowpack will be available in March as snow course measurements will be conducted near the beginning of the month.
- Environment Canada map of satellite estimation of plains snow water equivalent (SWE) as of January 11, 2014 is shown here, and as a % of normal here. The winter precipitation map shows above normal precipitation for most of the province.
- Alberta Agriculture publishes maps of modelled plains snow accumulations and accumulations as compared to normal.
Precipitation
Contoured maps of precipitation amounts and as a percent of normal for the past month and for current and recent seasons are available here. Maps of precipitation amounts for the most recent day, week and month to date are available here.
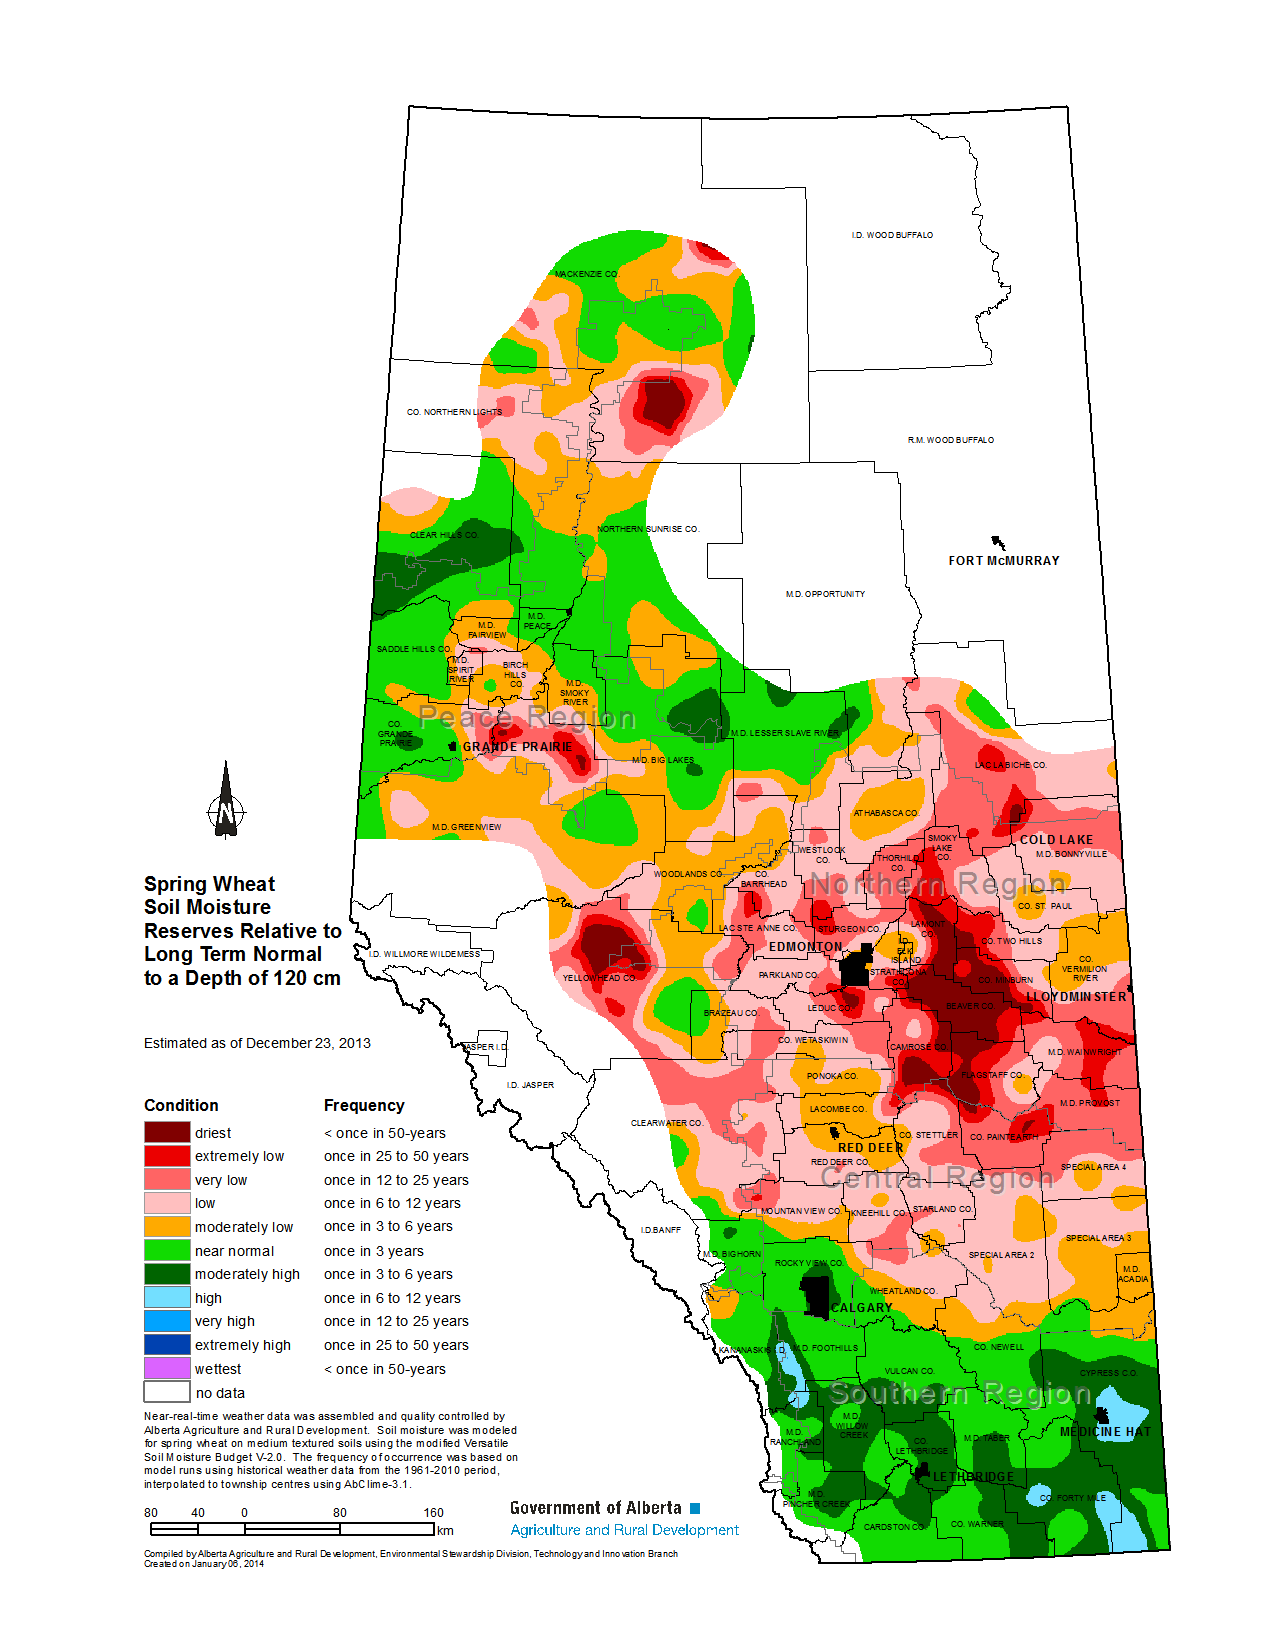
Soil Moisture
Alberta Agriculture models soil moisture for non-mountainous, agricultural areas of Alberta. Modelled soil moisture compared to average as of December 23, 2013 is available here.
Long Lead Precipitation Outlooks
Environment Canada (issued on December 31, 2013): below normal temperatures and above normal precipitation for Central, Southern and Northern Alberta during the January to March 2014 period.
National Oceanic and Atmospheric Administration (NOAA) (issued on December 19, 2013): normal precipitation and below normal to normal temperatures in Southern Alberta for January through March 2014.
Climate indicators: The NOAA reported on January 9, 2014 that ENSO-neutral is expected to continue into Summer 2014.
Note that forecasting weather for such a long time period into the future is very difficult, and so the historical accuracy has been variable, dependent on location and time period, and is often low, more so for precipitation than temperature. Environment Canada provides an assessment of their forecast method's historical accuracy on their website.
Reservoir storage
Water storage volumes in the major irrigation and hydroelectric reservoirs of the Milk, Oldman, Bow, Red Deer North Saskatchewan, and Athabasca River basins is updated each weekday and is available in the Provincial Reservoir Storage Summary.
Questions
Background information on the Water Supply Outlook is available in Frequently Asked Questions
Media Contact:
Communications Division, Alberta Environment
Phone: (780) 427-6267